Understanding the cost of gasoline in the United States has always felt like tracking a moving target, but 2025 has introduced unique regional dynamics that make the map more polarized than ever. While the national average has stabilized around $3.04 per gallon, the gap between the most expensive and most affordable states continues to widen. This disparity is not merely a product of supply and demand; it is a complex web of state-level legislation, environmental mandates, and geographical logistics that dictates what you pay at the pump.1 For the modern commuter, knowing where these price lines are drawn is essential for budgeting and cross-country travel planning.
The West Coast Premium and Regional Outliers
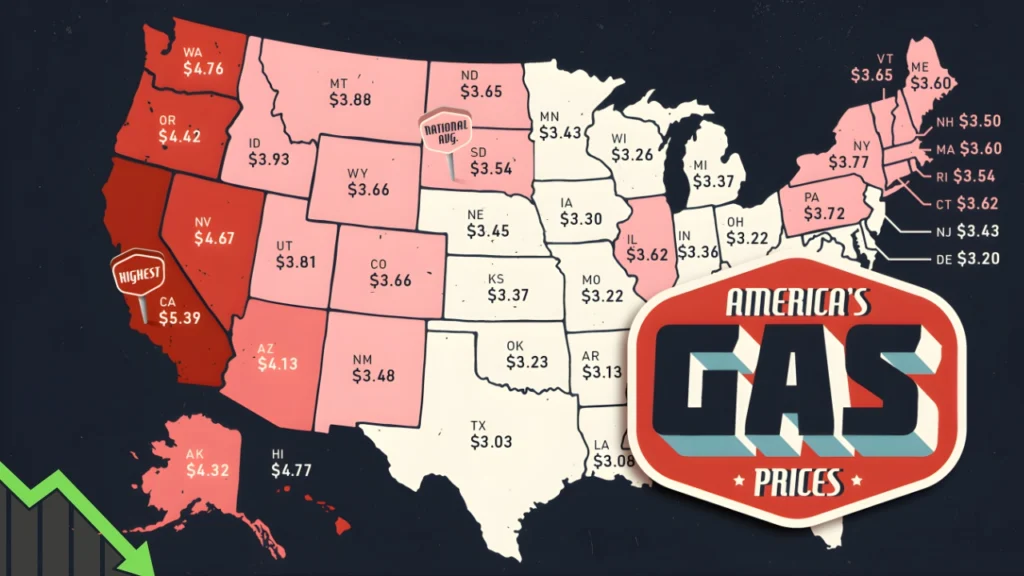
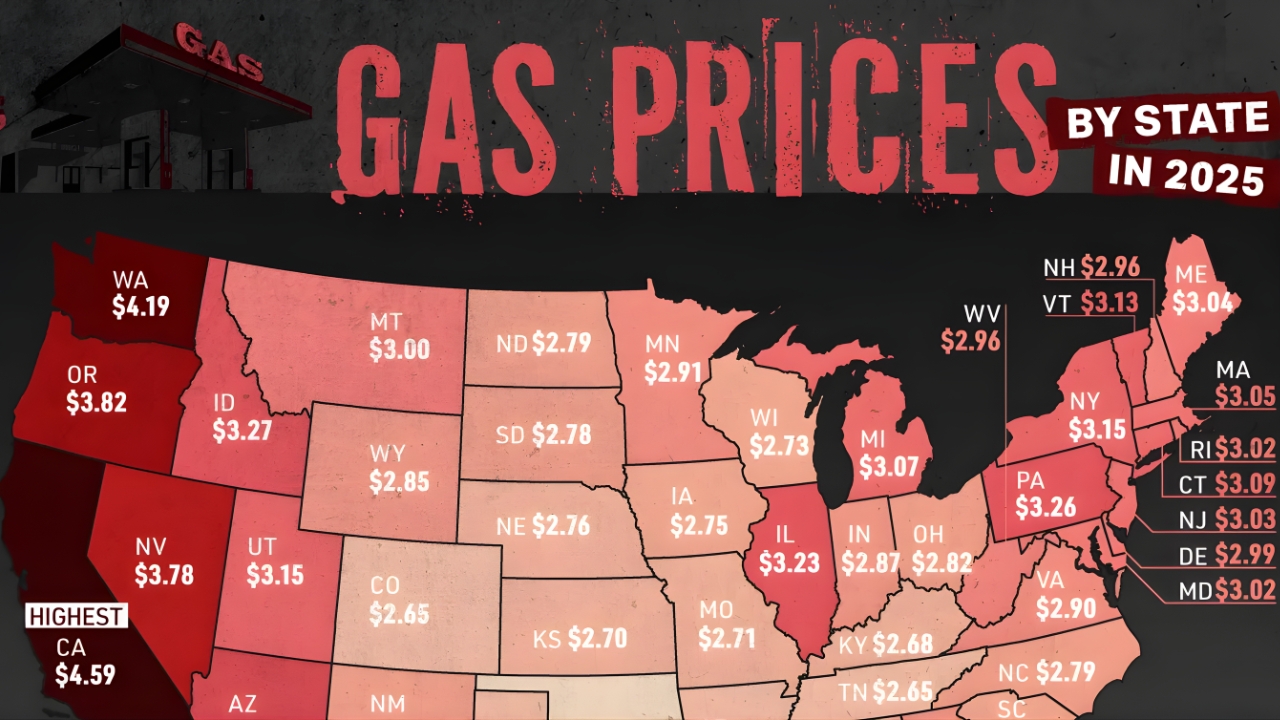
Drivers on the West Coast continue to shoulder the highest financial burden in the nation.2 California remains the perennial leader in fuel costs, with averages frequently hovering near $4.59 per gallon.3 This “premium” is largely attributed to the state’s aggressive carbon-pricing programs and strict requirements for specialized, cleaner-burning fuel blends that few refineries outside the region are equipped to produce.4 Similarly, Hawaii and Washington remain locked in the high-price bracket, with Hawaii’s costs driven by its extreme geographical isolation and Washington’s prices influenced by recent adjustments to its Climate Commitment Act.5 These states represent an expensive frontier where environmental policy and logistical hurdles converge.
Why Prices Vary So Drastically Between Borders
The question of why one state can be nearly two dollars cheaper than its neighbor often comes down to the “tax and track” factor. States like Oklahoma, Mississippi, and Texas benefit from a combination of lower state excise taxes and proximity to the Gulf Coast’s massive refining infrastructure.7 When a state sits directly on the supply line, transportation costs—often passed down to the consumer—are minimal. Conversely, states in the Northwest, such as Oregon and Idaho, saw some of the sharpest price increases this year due to tighter local inventories and higher costs associated with moving fuel through mountain corridors.

2025 Gas Price Comparison: Top vs. Bottom States
To better understand the current economic divide, the following data illustrates the stark contrast between the five most expensive and five most affordable states as of late 2025.
| Rank | State (Highest Prices) | Price Per Gallon | State (Lowest Prices) | Price Per Gallon |
| 1 | California | $4.59 | Oklahoma | $2.50 |
| 2 | Hawaii | $4.44 | Mississippi | $2.56 |
| 3 | Washington | $4.19 | Louisiana | $2.58 |
| 4 | Oregon | $3.82 | Texas | $2.61 |
| 5 | Nevada | $3.78 | Arkansas | $2.64 |
The Impact of Environmental Policy and Infrastructure
In 2025, the shift toward “green” legislation has become a primary driver of price divergence. Beyond the federal excise tax of 18.4 cents, states are increasingly using carbon taxes and low-carbon fuel standards to fund energy transitions. In California, these programs can add upwards of 50 cents to a single gallon. Meanwhile, states in the Midwest and South often maintain fixed-rate taxes focused purely on traditional infrastructure like road and bridge repair. This creates a regulatory “two-speed” America where your fuel bill is increasingly a reflection of your state’s environmental goals.
Seasonal Fluctuations and Refining Constraints
Even in a year of relative stability, seasonal “turnarounds” remain a significant factor.9 Every spring, refineries must switch from winter-grade to summer-grade gasoline, which is more expensive to produce due to the additives required to prevent evaporation in high heat.10 In 2025, refinery utilization rates have been closely watched, as any unplanned outage in the Midwest or Northeast can cause immediate localized price spikes. Additionally, as global oil production remains disciplined under OPEC+ guidelines, the base cost of crude oil keeps a floor on how low prices can actually go, regardless of local tax breaks
Will Relief Come in 2026?
Predicting the future of fuel is notoriously difficult, but several indicators suggest that the current regional gaps will persist. While inflation has cooled slightly, many states are moving toward “variable-rate” taxes that automatically adjust based on the Consumer Price Index or construction cost increases.11 This means that even if oil prices drop, the tax portion of your fuel bill may continue to climb. For consumers, the best strategy remains staying informed about local trends and utilizing fuel-tracking apps to find the best deals within their specific regions.

Big Day: Gas Prices Are Finally Falling, But How Much Will You Save?
FAQs 2025 Fuel Costs
Why is gas so much more expensive in California than in Texas?
California has higher state taxes, stricter environmental regulations requiring unique fuel blends, and a “cap-and-trade” program that adds significant costs to every gallon compared to the Gulf Coast states.12
Are gas prices expected to drop significantly this winter?
Generally, winter-grade fuel is cheaper to produce, and demand often dips after the summer travel season, leading to a modest decline in most states through January and February.13
How much of my gas price goes toward taxes?
On average, about 15% to 20% of the price you pay per gallon is comprised of federal and state taxes, though this can be much higher in states with aggressive climate policies.
Disclaimer
The content is intended for informational purposes only. You can check the official sources as our aim is to provide accurate information to all users.